Would you like to enhance your current Search Performance Reports? Over the last few months we’ve shared some hints and tips on the Empathy metrics that can be interesting to analyse alongside data from your current Analytics tool (Google Analytics, Adobe Analytics) as a way to have more meaningful insights about your search performance.
If you’re working on this Data Integration, I’d like to share with you how you can integrate this by using the Empathy Stats API and also, hopefully, to give you some inspiration by showing you how Empathy works with data retrieved from this API.
INTEGRATE EMPATHY AS A NEW DATA SOURCE IN YOUR ANALYSIS TOOL
The most popular data visualisation and analysis tools such as Power BI, Tableau or Google Data Studio, allow you to add multiple data sources within the same report, but what about your Search Performance Report? You might be populating it with just data from your Analytics tool (Google Analytics, Adobe Analytics…) but how about including Empathy as a new Data Source to merge into your project?
A Step by Step Guide:
- Add a new Data Source (CSV or Spreadsheet) to your project. All the tools mentioned before have Data Sources available that can be fed by data in spreadsheets or CSV files. You just need to select one of them. At empathy.co we’re currently working on an Open source connector for Google Data Studio which will make data integration much easier while also avoiding CSV or Spreadsheets! So, watch this space and we’ll share updates on this Data Studio integration in the following newsletters!!
Populate your CSV or Spreadsheet with Empathy Data. To populate these files, you need to be using the Empathy Stats API. The steps below will detail how you can gather all the necessary data from this Stats API: Log-in to the Stats API with your Empathy credentials.
Here are all the details you’ll need. Choose the Stats API report that meets your needs and perform the GET request with the specified parameters to obtain your data.
The Daily Distribution Report could be a good starting point as it provides the distribution of Empathy’s main KPIs on a daily basis. Adapt your CSV or Spreadsheet Data Source to the JSON/CSV object retrieved from the Stats API. If it’s simpler, you can modify the format of the JSON/CSV retrieved using a simple script.
- Create your graphs and voilà you have all the information you need in a unique Overall Search Perform Dashboard!
Now for the really fun part where you’re able to transform that data into meaningful insights. Here’s a simple example built in Google Data Studio using data retrieved from the Daily Distribution Report we mentioned before.
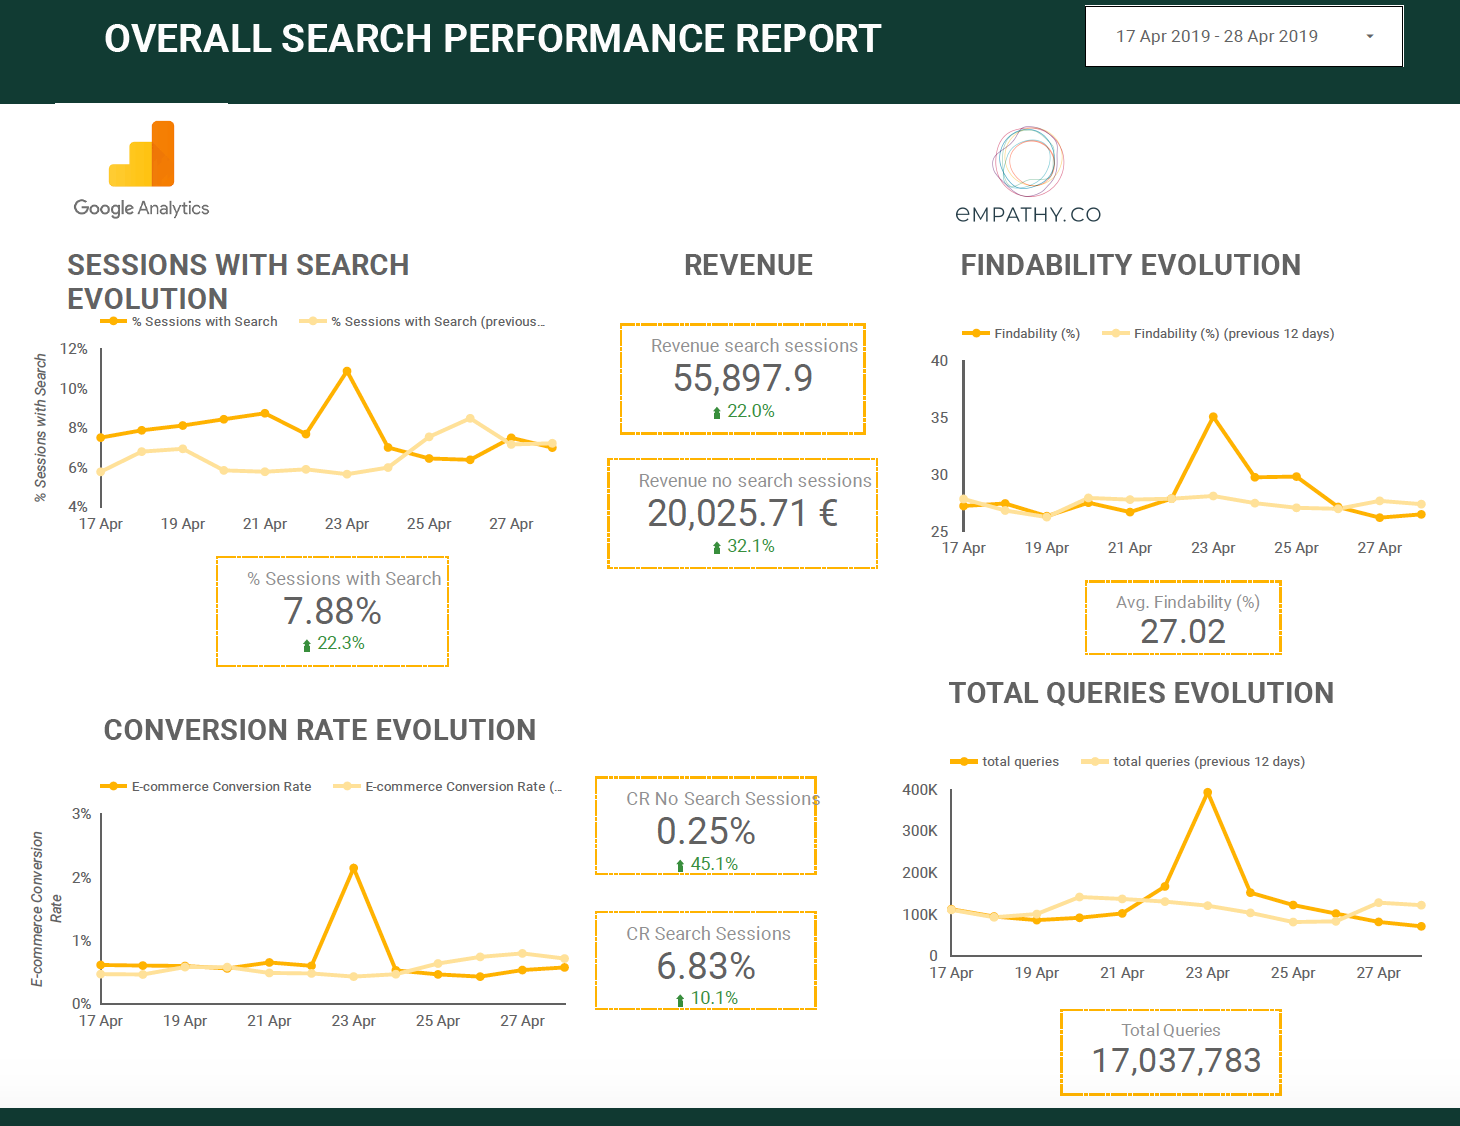
Google Data Studio Report integrating search Data from Empathy Stats API and Google Analytics
If you come across any issues with this integration on any reporting tool, we’re very happy and on hand to help. Just contact our Insights Team on insights@empathy.co.
SOME INSPIRATION. THIS IS HOW WE DO IT
All the reports that are available through the Empathy Insights and the ones visible in the Empathy Dashboard are built using data retrieved from the Stats API. Below are the details of the reports on the Stats API needed to build some of the existing reports in Empathy that could inspire you:
- Seasonal Keywords Visualisation. The Keyword Report is used here to obtain keyword performance during specifics periods.
- Now Visualisation uses data from the Trending Stats Report to have a real-time picture about queries, clicks and no results.
- Search Performance Visualisation collects data from the Daily Distribution Report in its Pivot variation. In this way you can easily obtain main KPIs drilled down by scope.
All these visualisations have been created to facilitate the data gathering process to then display search data for different scopes which, in turn, can be easily filtered to obtain any particular search performance detail or analysis. So, now you can start building your own ones and within your current Data Visualisation tool!
As mentioned above, we are working on a new open-source connector for Google Data Studio to have all your search data in one, single report through a super-easy way. Make sure you follow our next posts or subscribe to our newsletter to be the first to receive these updates!